I work as a service designer embedded in enterprise operations, making complex operations visible so teams can decide faster. At GfK that meant replacing legacy platform documentation with a layered service blueprint that 150 stakeholders adopted as the source of truth.
Role
Lead service designer, 2023
92post adoption NPS score
150stakeholders adopted across seven regions
The problem
GfK runs market intelligence for the world's largest brands and retailers across more than 60 countries and 100,000 retail partnerships with weekly delivery. The Data Platform behind it spanned decades of process, from POS and panel ingestion through harmonisation to activation, and its only map was a flat diagram that hid more than it showed. Ownership was unclear, workflows fragmented and planning slow because nobody could point at where work stalled.
So before drawing a single blueprint line I spent nine months measuring where work stalled and who it stalled on.
The research behind the blueprint. Nine months of fieldwork across seven regions, 1,412 coded statements and the trail from evidence to blueprint layer. Every figure carries its provenance. Drag to pan. Use the toolbar or scroll to zoom. Use the X button to close.
Constraints
The replacement had to meet four conditions. Hold across 150 people, seven regions and four tiers of involvement. Drop in as the reference teams actually used, or the old diagram would survive. Carry continuous improvement rather than describe a current state. And clarify who decides what without an org redesign.
Quantify the problem before blueprinting
The canvas above turned complaint volume into a priority order. Ownership and accountability led at 27 percent, the biggest driver of delays and where decision rights were fractured. Process and standards, then tools and documentation, followed at 22 percent each. The three clusters became the spine of the blueprint and its decision hierarchy.
Build layers, not a flatter diagram
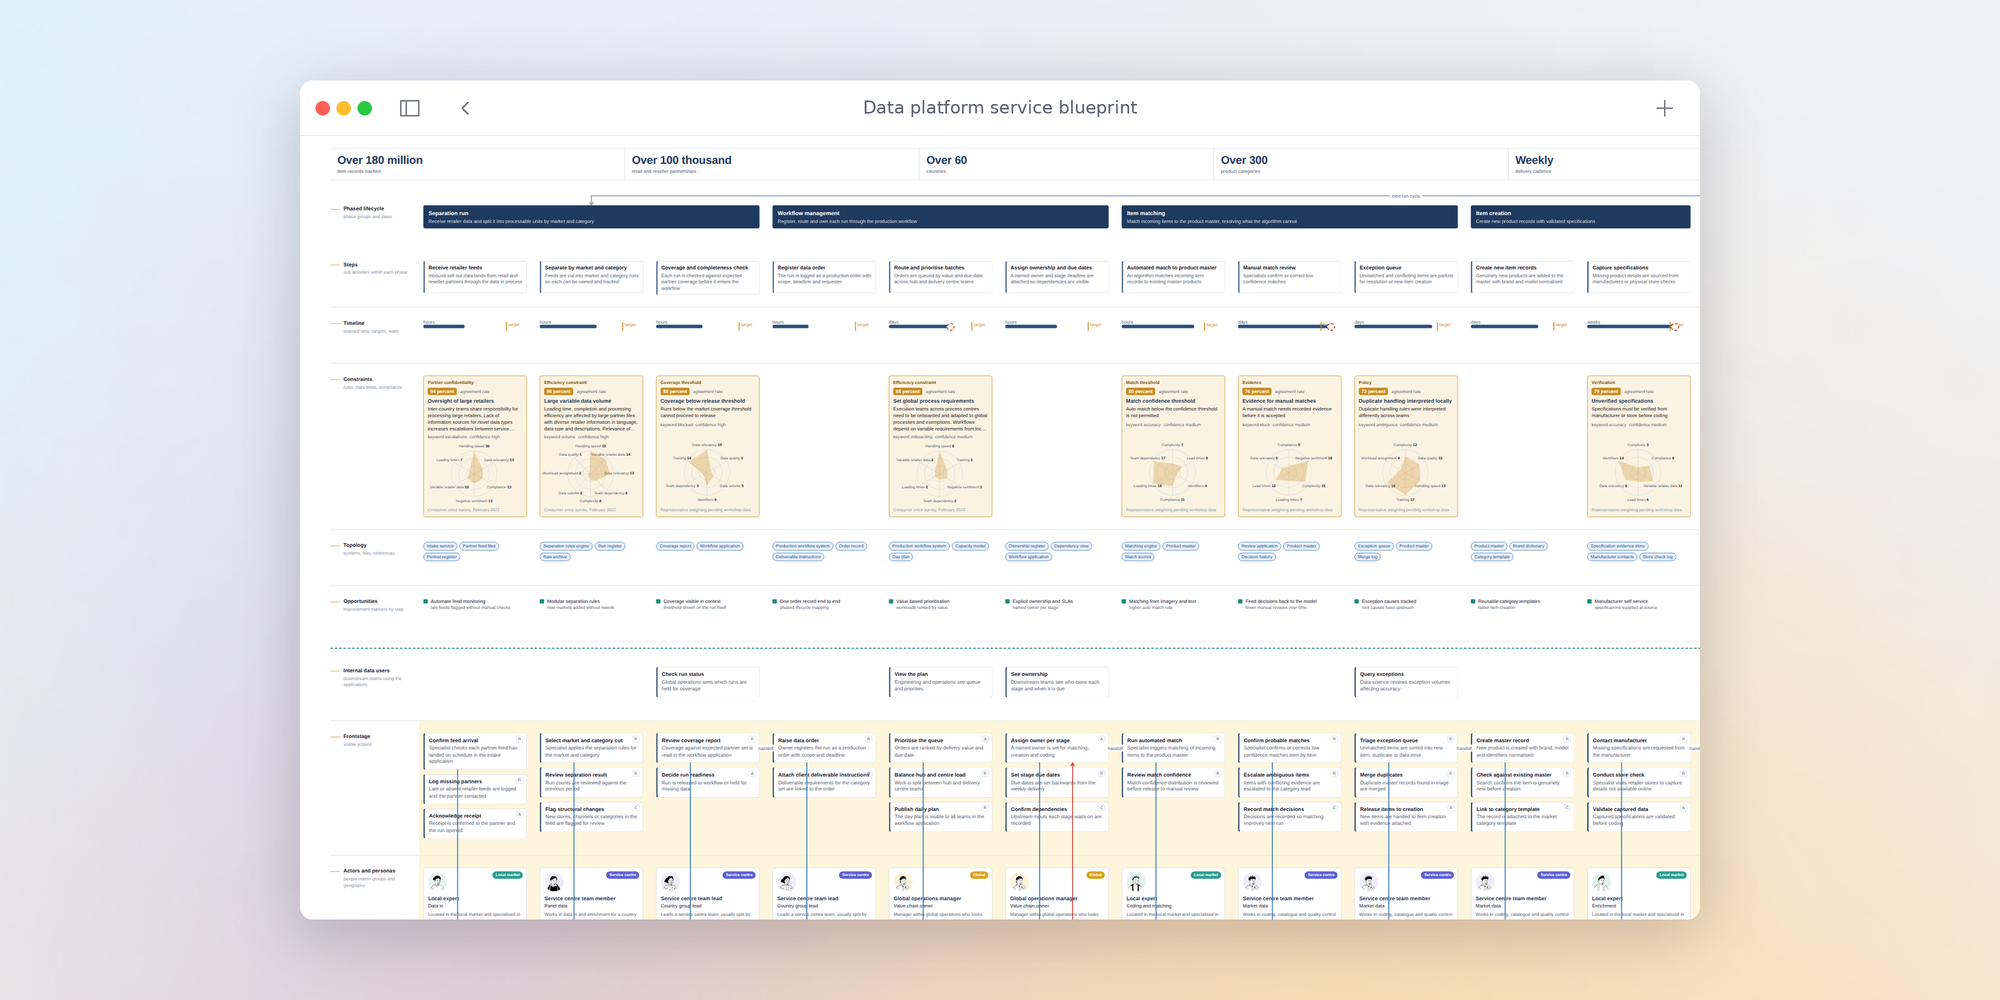
A more detailed flat diagram would have reproduced the problem at higher resolution. Instead the blueprint maps six phases and seventeen steps through ten stacked layers, from lifecycle and timeline down to frontstage, backstage, supporting processes and risks. Engineering reads topology and constraints, ops reads frontstage and backstage, leadership reads lifecycle and opportunities. Each role enters at its own layer, so one artefact replaced the old diagram outright.
Build it to change, not to describe
A current state blueprint is stale the week it ships, which is how the legacy diagram died. This one carries change. An opportunities layer marks friction and roadmap candidates at each step. Constraint tokens size and score every rule so a stall can be scheduled rather than described. A risks layer tracks hazard, mitigation and escalation. Roadmap sign off fell from 21 days to 3.
The full blueprint. Six phases, seventeen steps and the layer stack, from timeline and constraints to risks, evidence and metrics, each traceable back to the research above. Drag to pan. Use the toolbar or scroll to zoom. Use the X button to close.
Payoff
The blueprint replaced the legacy documentation outright.
Adoption. 150 stakeholders across seven regions took it up as the single reference for service operations
Governance. It became the leading source of truth for decision rights and standards
Speed. Roadmap sign off fell from 21 days to 3
Sentiment. Post adoption NPS of 92
"Before the Service Blueprint, stage gates felt like guesswork. The new delivery roadmap clarified who does what and when, and the segmented decision hierarchy with a simple matrix removed ambiguity at each processing stage."